Master curve
For asphalt bound materials the modulus is determined from a model of the format used in MEPDG:
![]()
Equation: MEPDG Asphalt modulus versus reduced time (master curve).
where E is the modulus in MPa,
tr is reduced time in sec,
α, β, γ, and δ are constants, and
logarithms are to base 10.
Reduced time is found from:
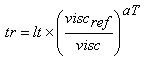
Equation: Reduced time as function of loading time and viscosity of binder.
where lt is the loading time (in sec)
viscref is the binder viscosity at the reference temperature,
visc is the binder viscosity at the present temperature, and
aT is a constant.
![]()
Equation: Binder viscosity, cPoise, as a function of temperature.
where TK is the temperature (in °K), and
A and VTS are constants.
To get the loglog linear relationship of the equation the viscosity must be given in cPoise. The SI unit for viscosity is Pa•sec (= 10 Poise = 10 Stoke (St)).
For asphalt materials the temperature is calculated at a depth one third into the material and the loading time is calculated as 200 mm plus the depth one third into the material, divided by the wheel speed in mm/sec ([200 + z]/speed).
Examples of the viscosity parameters are shown below, given for temperature in ºR (A ºK = A ºR + VTS×log(9/5)). A given mix modulus versus temperature relationship can, however, be fitted quite well with a number of different viscosity versus temperature relationships.
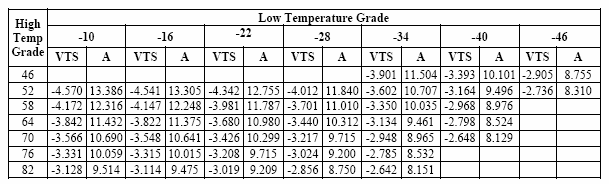
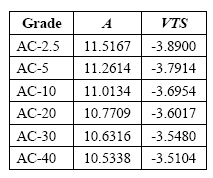
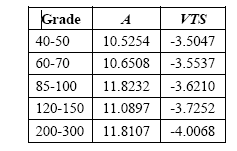
Viscosity susceptibility parameters recommended by MEPDG for PG, viscosity and penetration grades.
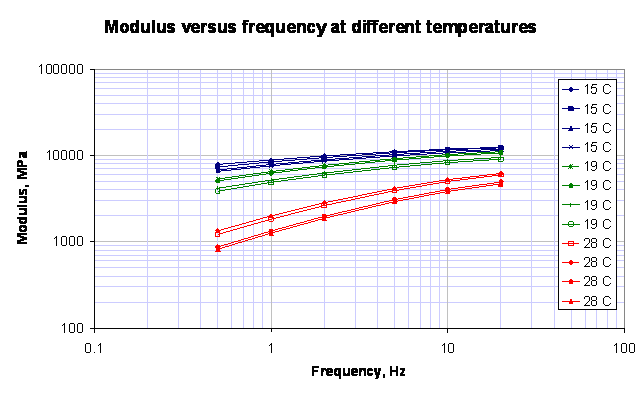
The figure below shows the results of frequency sweep tests done at three different temperatures (15, 19 and 28 oC)
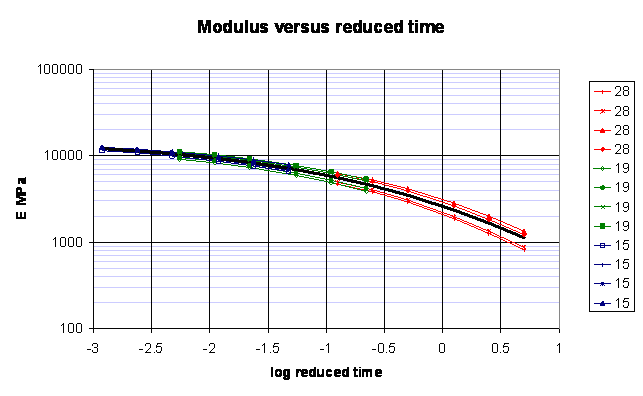
It was assumed that the binder viscosity could be described by A = 9.6307 and VTS = -3.5047 (temperatures in degree Kelvin). The master curve is not sensitive to the selection of binder parameters and almost any of the combinations given in the tables above could have been used.
The measured moduli were fitted to the master curve equation using Solver in an Excel spreadsheet and minimising the Root Mean Square (RMS) difference between the measured values and the values calculated from the master curve equation. In the following figure the measured moduli are plotted against reduced time. The heavy black line is the master curve equation.
The master curve equation for this case was:
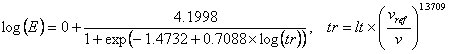
In this case the minimum modulus was assumed to be 1 MPa in order to fit the measured moduli. For use with CalME a minimum modulus of 100 to 200 MPa, corresponding to the modulus of the aggregate alone, is recommended even though it may not fit the laboratory data as well.